Blog
Better questions start with better events.
Practical writing for builders who want useful analytics without turning their product into a data-engineering project.
Start here
Essential reading

Event Tracking Best Practices: How to Name and Structure Analytics Events
Bad event naming and bloated payloads make analytics painful. These event tracking best practices cover naming conventions, property design, cardinality, and PII hygiene.

10 ClickHouse SQL Queries for Product Analytics
Ten practical ClickHouse queries for active users, accounts, activation, revenue, latency, errors, funnels, adoption, and deduplication.

How to Embed Analytics Dashboards in Your SaaS Product
Customer-facing analytics without building a charting stack: how to embed dashboards in your SaaS with per-user filtering, iframes, and caching.
8 articles
Product analytics
Measure activation, retention, experiments, revenue, and the paths between them.

A/B Testing 101: How to Run Experiments That Actually Tell You Something
A/B testing without a stats degree: split traffic correctly, pick one primary metric, avoid peeking, and read results you can trust.

API Analytics 101: What to Measure and Why
API analytics tells you who uses your API, which endpoints struggle, and where errors spike. The metrics that matter and how to start collecting them.

B2B Product Analytics: Measure Accounts, Not Just Users
A practical B2B analytics model for account identity, activation, feature adoption, retention, and customer-facing usage.

Churn Analysis 101: Find Out Why Customers Leave
Churn analysis: how to measure customer churn, separate voluntary from involuntary churn, and find the causes actually worth fixing.

How to Build a Dashboard People Actually Use
How to build a dashboard your team will actually check: pick the right metrics, choose the right charts, and solve the data plumbing the easy way.

The 8 SaaS Metrics Every Founder Should Track
MRR, churn, LTV, CAC and the other SaaS metrics that actually matter - with plain-English definitions, formulas, and rules of thumb.

Funnel Analysis 101: How to Find Where Users Drop Off
What funnel analysis is, how to build conversion funnels from event data, and how to read and fix drop-offs.

Retention Curves 101: How to Measure and Improve Cohort Retention
What retention curves are, how to read them, and how to build cohort retention analysis from raw event data.
11 articles
Guides
Concrete walkthroughs for instrumentation, dashboards, embeds, integrations, and SQL.
A Product Analytics Tracking Plan Teams Will Actually Maintain
Build a lightweight tracking plan that connects decisions to events, types, privacy rules, ownership, testing, and release reviews.
How to Embed Analytics Dashboards in Your SaaS Product
Customer-facing analytics without building a charting stack: how to embed dashboards in your SaaS with per-user filtering, iframes, and caching.

How to Log and Debug Webhooks (Before They Break in Production)
Webhooks fail silently. Log safe delivery metadata, preserve payloads in the right operational system, and alert before customers notice.

How to Migrate Product Analytics Without Breaking Your Metrics
A safe analytics migration playbook for historical exports, identity mapping, resumable backfills, dual writing, and reconciliation.
10 ClickHouse SQL Queries for Product Analytics
Ten practical ClickHouse queries for active users, accounts, activation, revenue, latency, errors, funnels, adoption, and deduplication.
Event Tracking Best Practices: How to Name and Structure Analytics Events
Bad event naming and bloated payloads make analytics painful. These event tracking best practices cover naming conventions, property design, cardinality, and PII hygiene.

How to Add Analytics to Your Next.js App
Track signups, purchases and custom events in your Next.js app with a few lines of server-side code and GraphJSON.
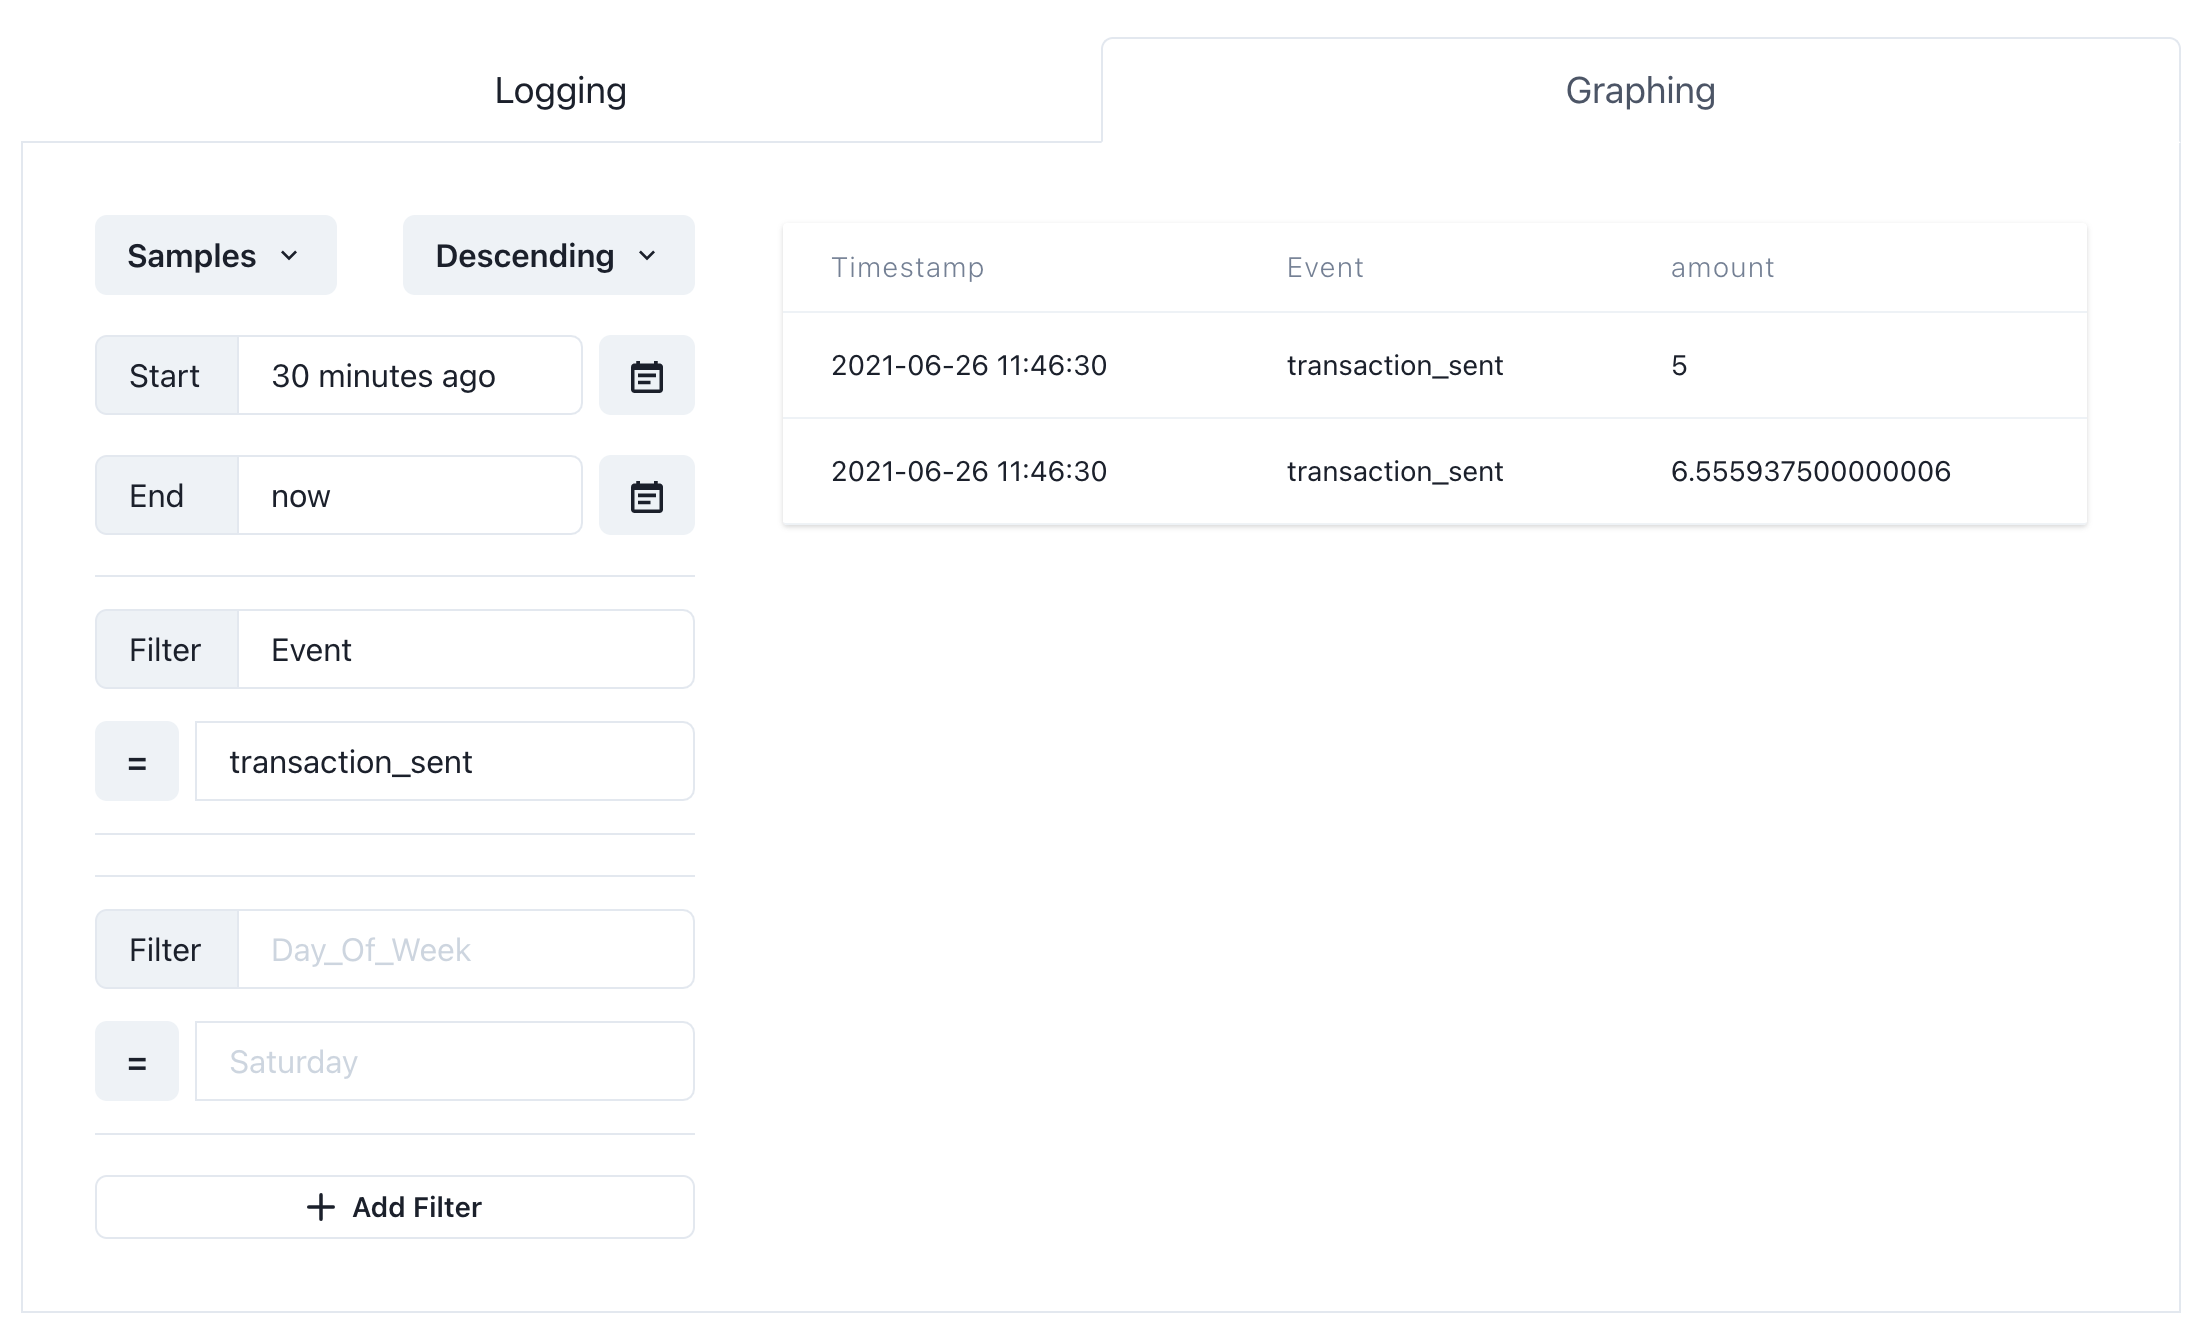
How to Build a Live Metrics /Open Page for Your Startup
Learn how to build a public /open metrics page with live graphs using GraphJSON, like BannerBear and NomadList.

How to Build a Stripe Revenue Dashboard
Forward Stripe webhook events to GraphJSON and build a live revenue dashboard: MRR, new subscriptions, failed payments and more.
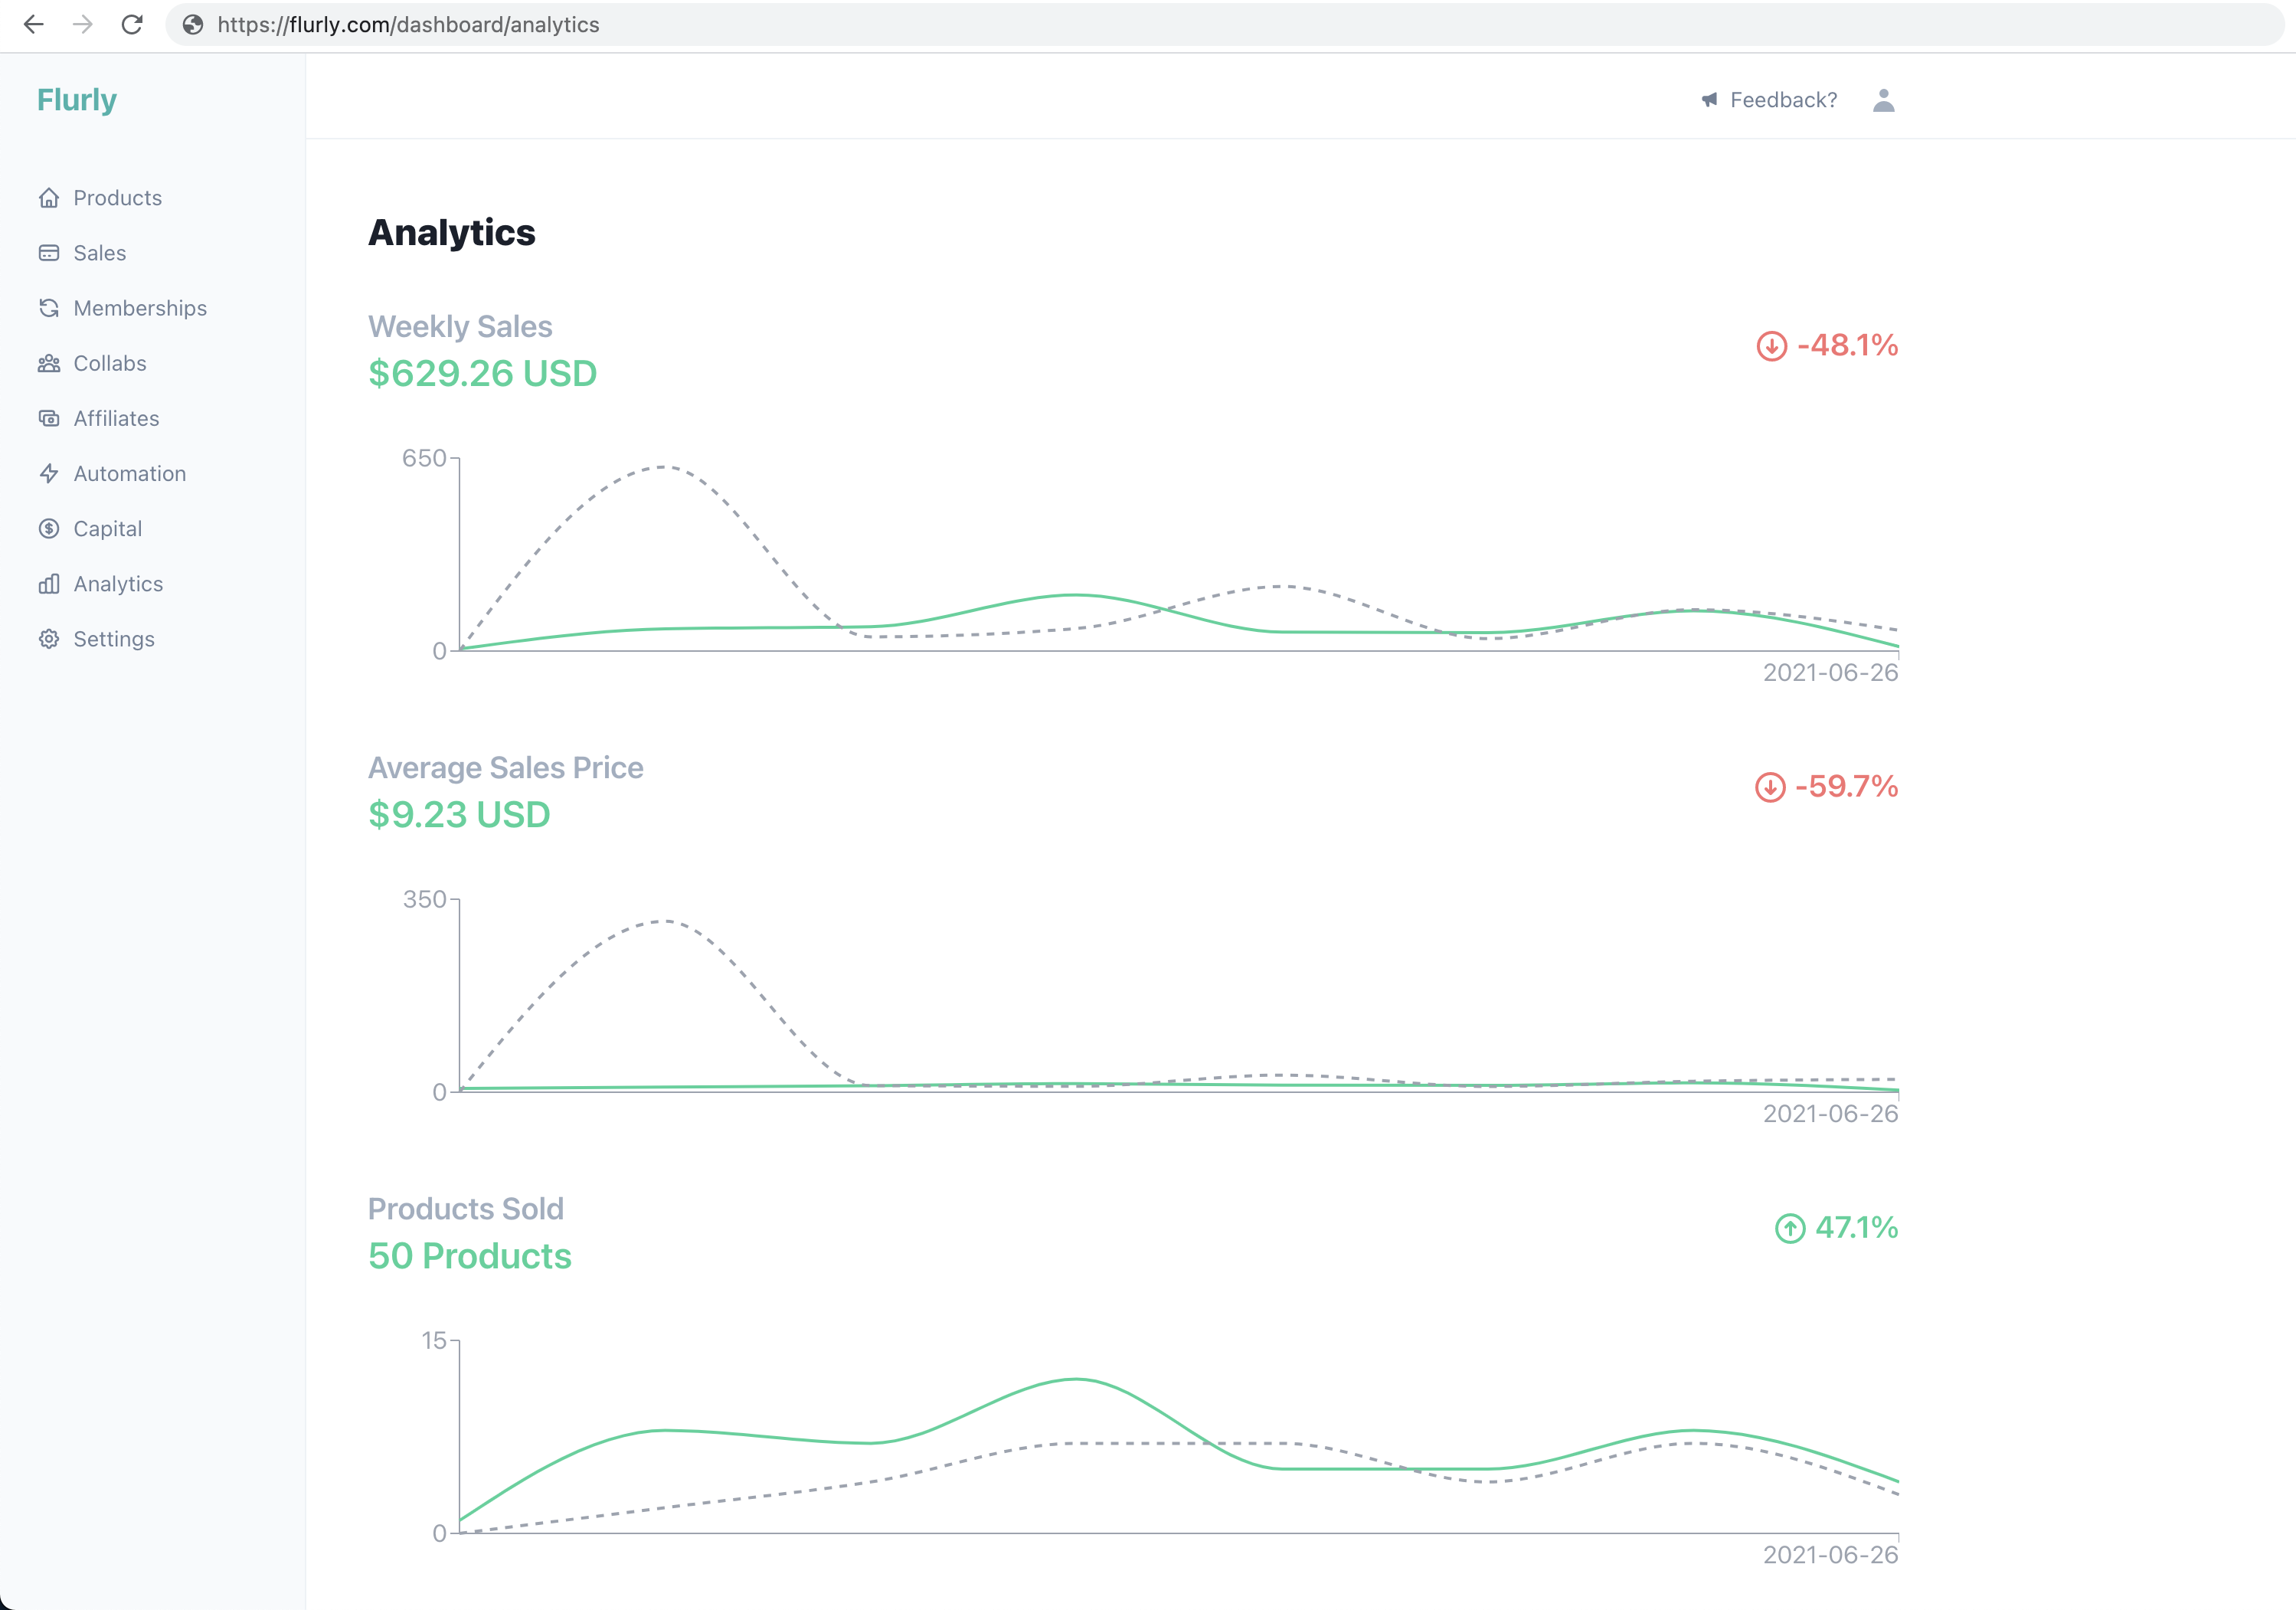
How to Build Personalized User Dashboards in an Afternoon
Use GraphJSON's dynamic iframe API to embed personalized, per-user analytics dashboards in your product.

How to Set Up Vercel Logging with Log Drains
Stream your Vercel logs into GraphJSON with a one-click log drain integration and turn them into dashboards, alerts and SQL queries.
14 articles
Engineering
The data models, databases, and operating choices behind real-time event analytics.

Did That Deploy Break Anything? Release Impact Analytics
Log deployments alongside application events to compare errors, latency, activation, and conversion by release.
How to Build a Reliable Analytics Event Pipeline
Queues, outboxes, retries, event IDs, deduplication, and reconciliation for analytics events you cannot afford to lose silently.

How to Query JSON in ClickHouse
ClickHouse stores JSON as strings and extracts fields at query time. A practical guide to JSONExtract, arrays, and materialized columns.

LLM Analytics: Measure Cost, Latency, Adoption, and Quality
A practical event contract for understanding which AI features users adopt, what model calls cost, where latency spikes, and whether quality improves.

Privacy-First Product Analytics Without Losing Useful Answers
Use purpose limitation, opaque IDs, collection boundaries, consent controls, retention, and deletion runbooks to reduce analytics risk.

Structured Logging 101: Why JSON Won
Structured logging means emitting logs as JSON objects instead of text lines. Here's why JSON won, and the conventions that make logs actually useful.
ClickHouse vs Elasticsearch for Log Analytics
ClickHouse vs Elasticsearch for log analytics: columnar storage vs inverted indexes, aggregation speed, compression, and when each database is the right choice for logs.

Why ClickHouse is Superior to PostgreSQL for Analytics Workloads
ClickHouse vs PostgreSQL for analytics: columnar storage, compression, vectorized execution, and when each database is the right tool.

Building Real-Time Analytics with ClickHouse
A practical architecture for real-time analytics in ClickHouse: ingestion, ordering, materialized views, late data, dashboard queries, and alerts.
Data Warehouse Best Practices That Prevent Expensive Rework
Practical guidance for warehouse grain, layers, idempotent pipelines, timestamps, data quality, privacy, cost, and ownership.

ClickHouse vs Cassandra: Choose by Query Pattern
ClickHouse and Cassandra both scale horizontally, but solve different problems. Compare their storage models, query patterns, consistency, and operational fit.

Why JSON Is a Good Event Format—and Where It Breaks
JSON makes event ingestion portable and flexible. Learn the design conventions, query tradeoffs, performance limits, and schema practices that keep it useful.

ClickHouse vs MongoDB for Analytics
MongoDB is a flexible operational document database; ClickHouse is a columnar analytical database. Here is where each fits—and when to use both.

Event Sourcing: The Benefits, Costs, and a Practical Starting Point
Event sourcing reconstructs application state from immutable domain events. Learn where it helps, where it hurts, and how it differs from analytics event tracking.
8 articles
Comparisons
Clear-eyed comparisons to help you choose the right analytics stack for your workload.
GraphJSON vs Segment
GraphJSON vs Segment: Segment routes events to other tools; GraphJSON stores and analyzes them. When you need a CDP, and when you just need analytics.

Embedded Analytics: An Honest Build vs Buy Guide
Should you build customer-facing analytics yourself or buy a tool? A practical framework with real costs and trade-offs.

GraphJSON vs Amplitude
GraphJSON vs Amplitude compared: schemaless JSON event logging, full SQL access, embeddable visualizations, and transparent per-event pricing.

GraphJSON vs Grafana
GraphJSON vs Grafana: compare a managed JSON event analytics product with an open-source dashboard layer for infrastructure and observability.

GraphJSON vs PostHog
GraphJSON vs PostHog compared: a dead simple JSON logging and visualization platform vs an all-in-one open-source product analytics suite.

GraphJSON vs Mixpanel
Mixpanel offers a mature product analytics workflow; GraphJSON offers flexible JSON ingestion, direct ClickHouse SQL, alerts, and embeds. Compare the fit.

GraphJSON vs Google Analytics 4
Google Analytics 4 excels at web and acquisition reporting; GraphJSON handles arbitrary server-side JSON events, SQL, alerts, and embedded analytics.

GraphJSON vs Datadog: Product Events or Observability?
Datadog is a broad observability platform; GraphJSON is a focused JSON event analytics product. Compare the workflows and learn when the tools belong together.
1 article
Company
How GraphJSON is built, why it exists, and where it is going.
