Why We Built GraphJSON
The product idea behind GraphJSON: make the distance between sending a JSON event and understanding it as short as possible.

Most analytics products begin after the difficult work is done. They assume your events already flow through a reliable pipeline, land in a warehouse, conform to a stable schema, and are ready for someone to model. That is reasonable for a large data team. It is a terrible place for a small product team to start.
GraphJSON began with a narrower question: what if the first useful graph required nothing more than sending the JSON your application already knows how to produce?
This launch note was originally published in 2021 and updated in 2026 to reflect the product today.
The event is the natural unit#
Applications already produce a stream of facts:
{
  "event": "report_created",
  "account_id": "acct_42",
  "plan": "pro",
  "duration_ms": 1840
}
That object is understandable to a person, serializable in every mainstream programming language, and useful before anybody creates a star schema. GraphJSON keeps that advantage instead of asking you to translate it into a vendor-specific tracking model.
Behind the product is an event table in ClickHouse, with account and collection boundaries, an event timestamp, and the original JSON payload.
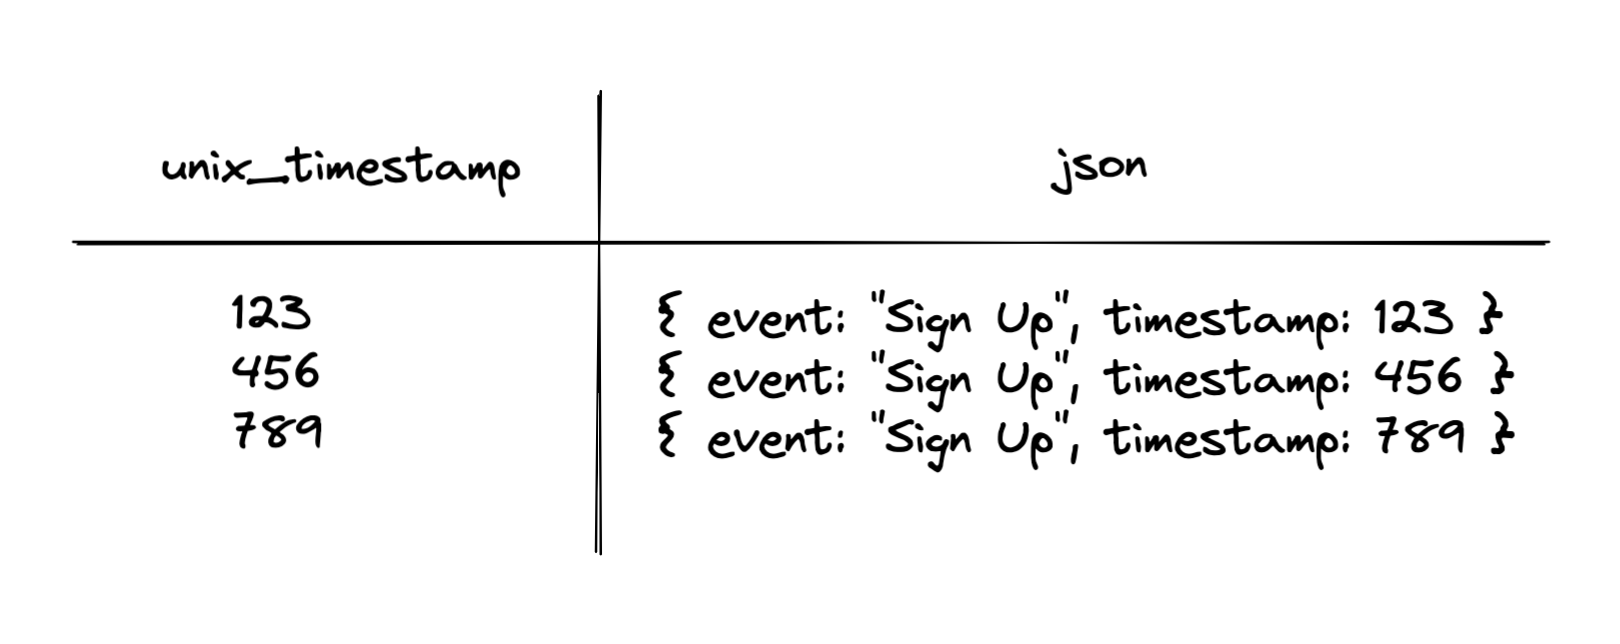
This shape lets an event acquire a new property without a migration. The plan field can appear today and workspace_size tomorrow. Both become explorable without blocking a release on a data-modeling project.
Flexibility is not permission to log chaos. Stable names, user identifiers, timestamps, and deliberate handling of sensitive data still matter. Our event schema guide explains the conventions that keep flexible events useful.
Why ClickHouse sits underneath#
Most questions about event data are analytical:
- how many accounts completed an action each day?
- what is the p95 duration by plan?
- where do users leave a signup funnel?
- how does this cohort retain after four weeks?
Those queries scan and aggregate many rows while touching only a few fields. ClickHouse is built for that pattern: columnar storage reduces unnecessary reads, compression keeps repetitive event fields compact, and vectorized execution processes values in batches.
The result is not just speed for its own sake. Fast queries change the interface we can build. Suggestions can appear while you explore. A dashboard can answer a new filter without waiting for a scheduled rollup. SQL can remain interactive over an event history that would make an application database uncomfortable.
The visualizer handles the common path#
Raw SQL is expressive, but it should not be the admission price for asking a basic question. The GraphJSON visualizer turns filters, groupings, time buckets, and aggregations into queries for you.
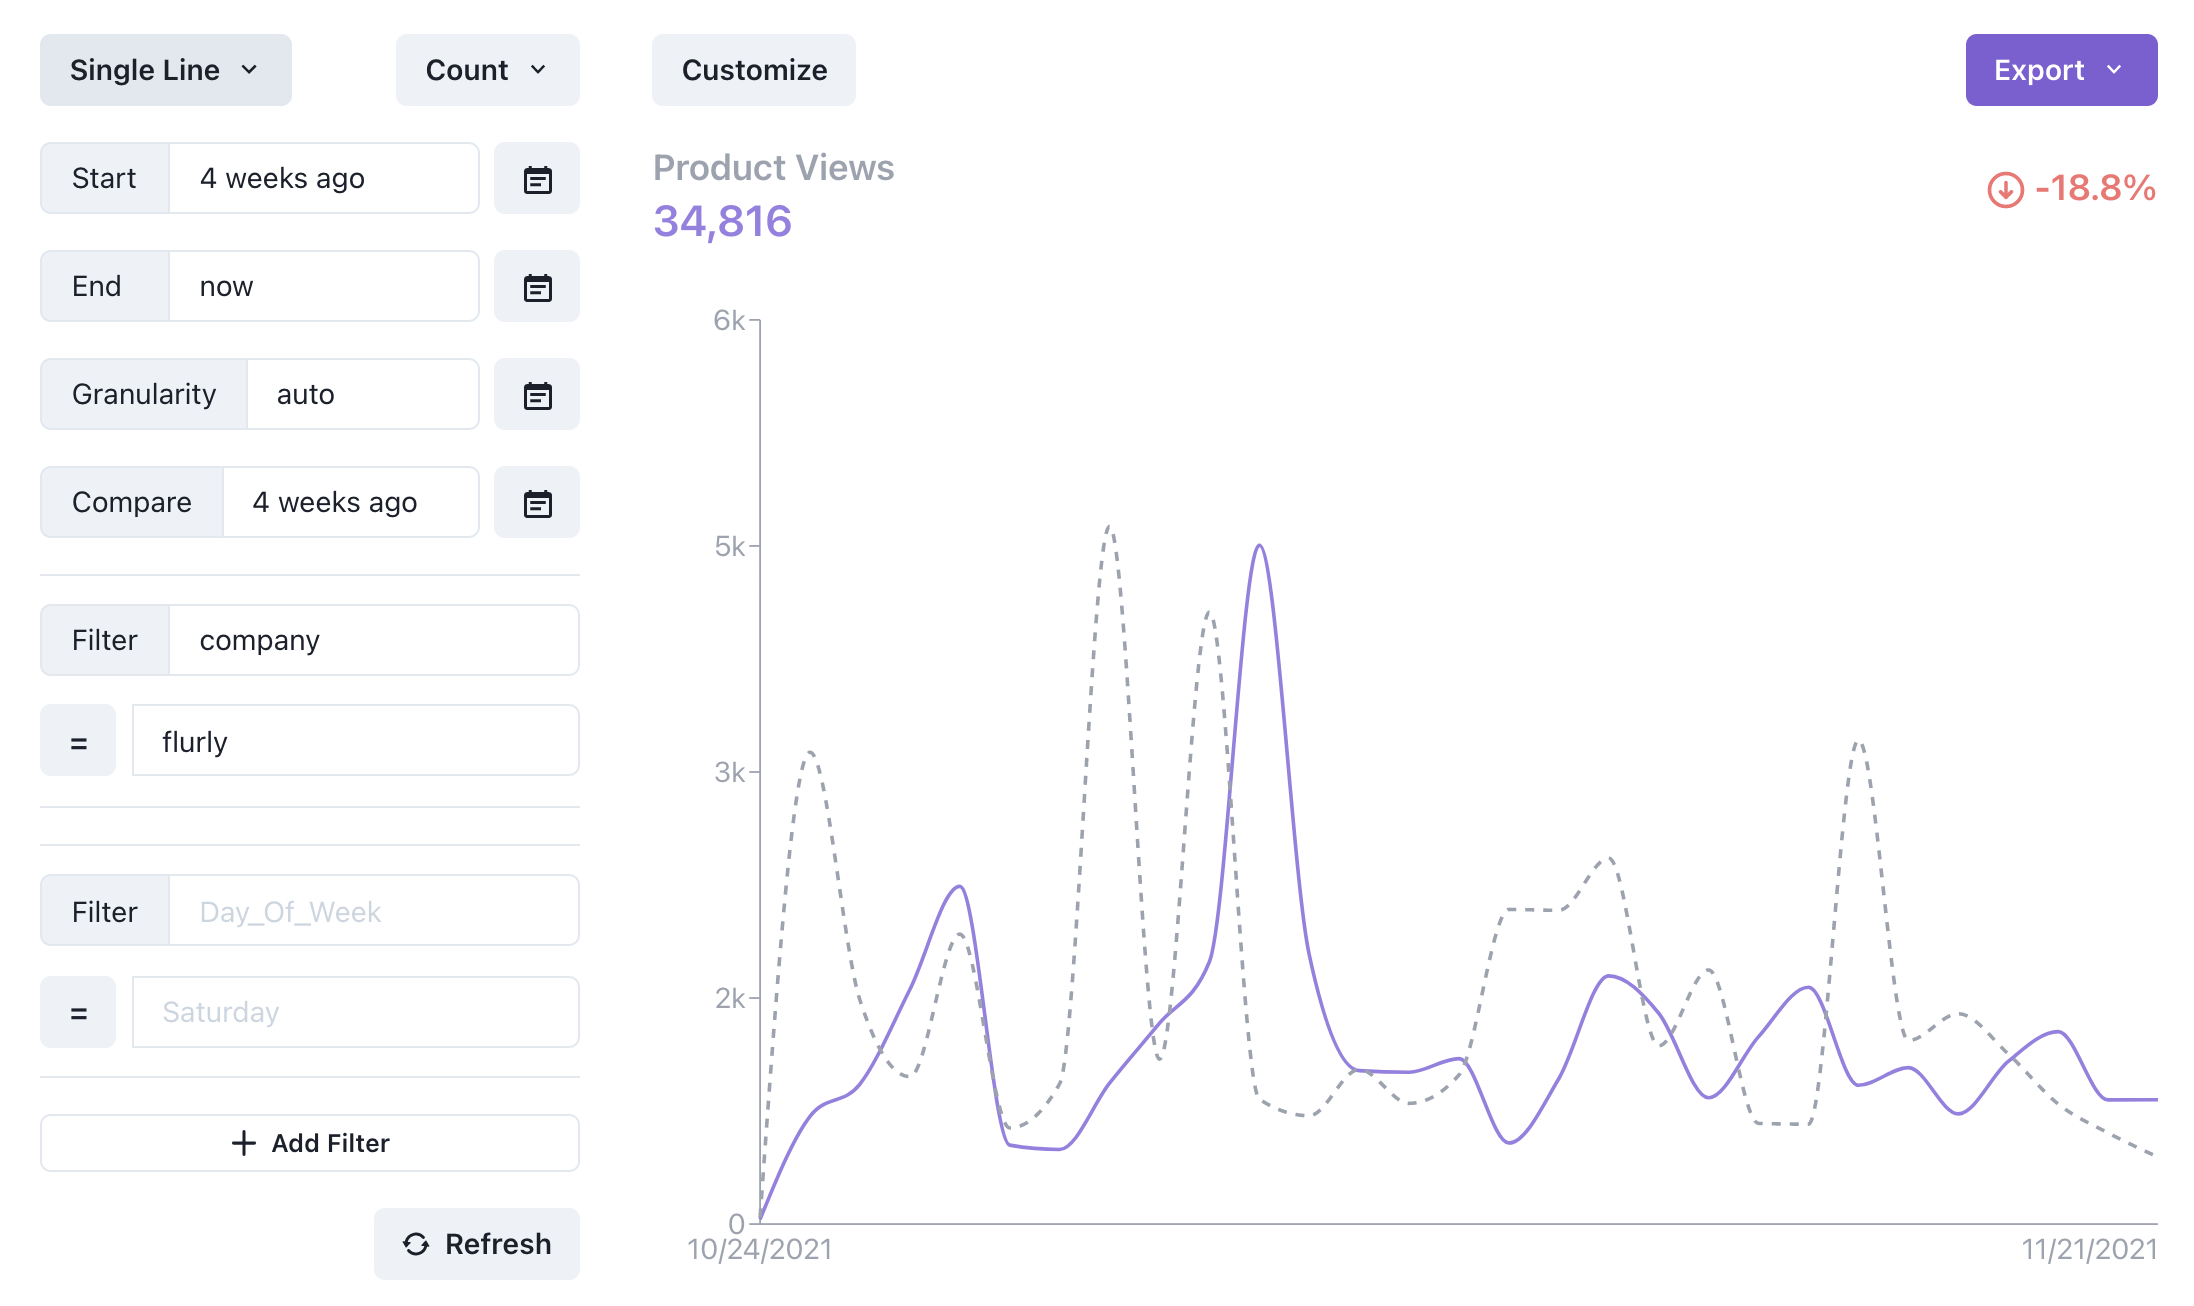
Field and value suggestions remove another source of friction: you do not need to remember whether the payload used account_id, accountId, or workspace_id before you can investigate it.
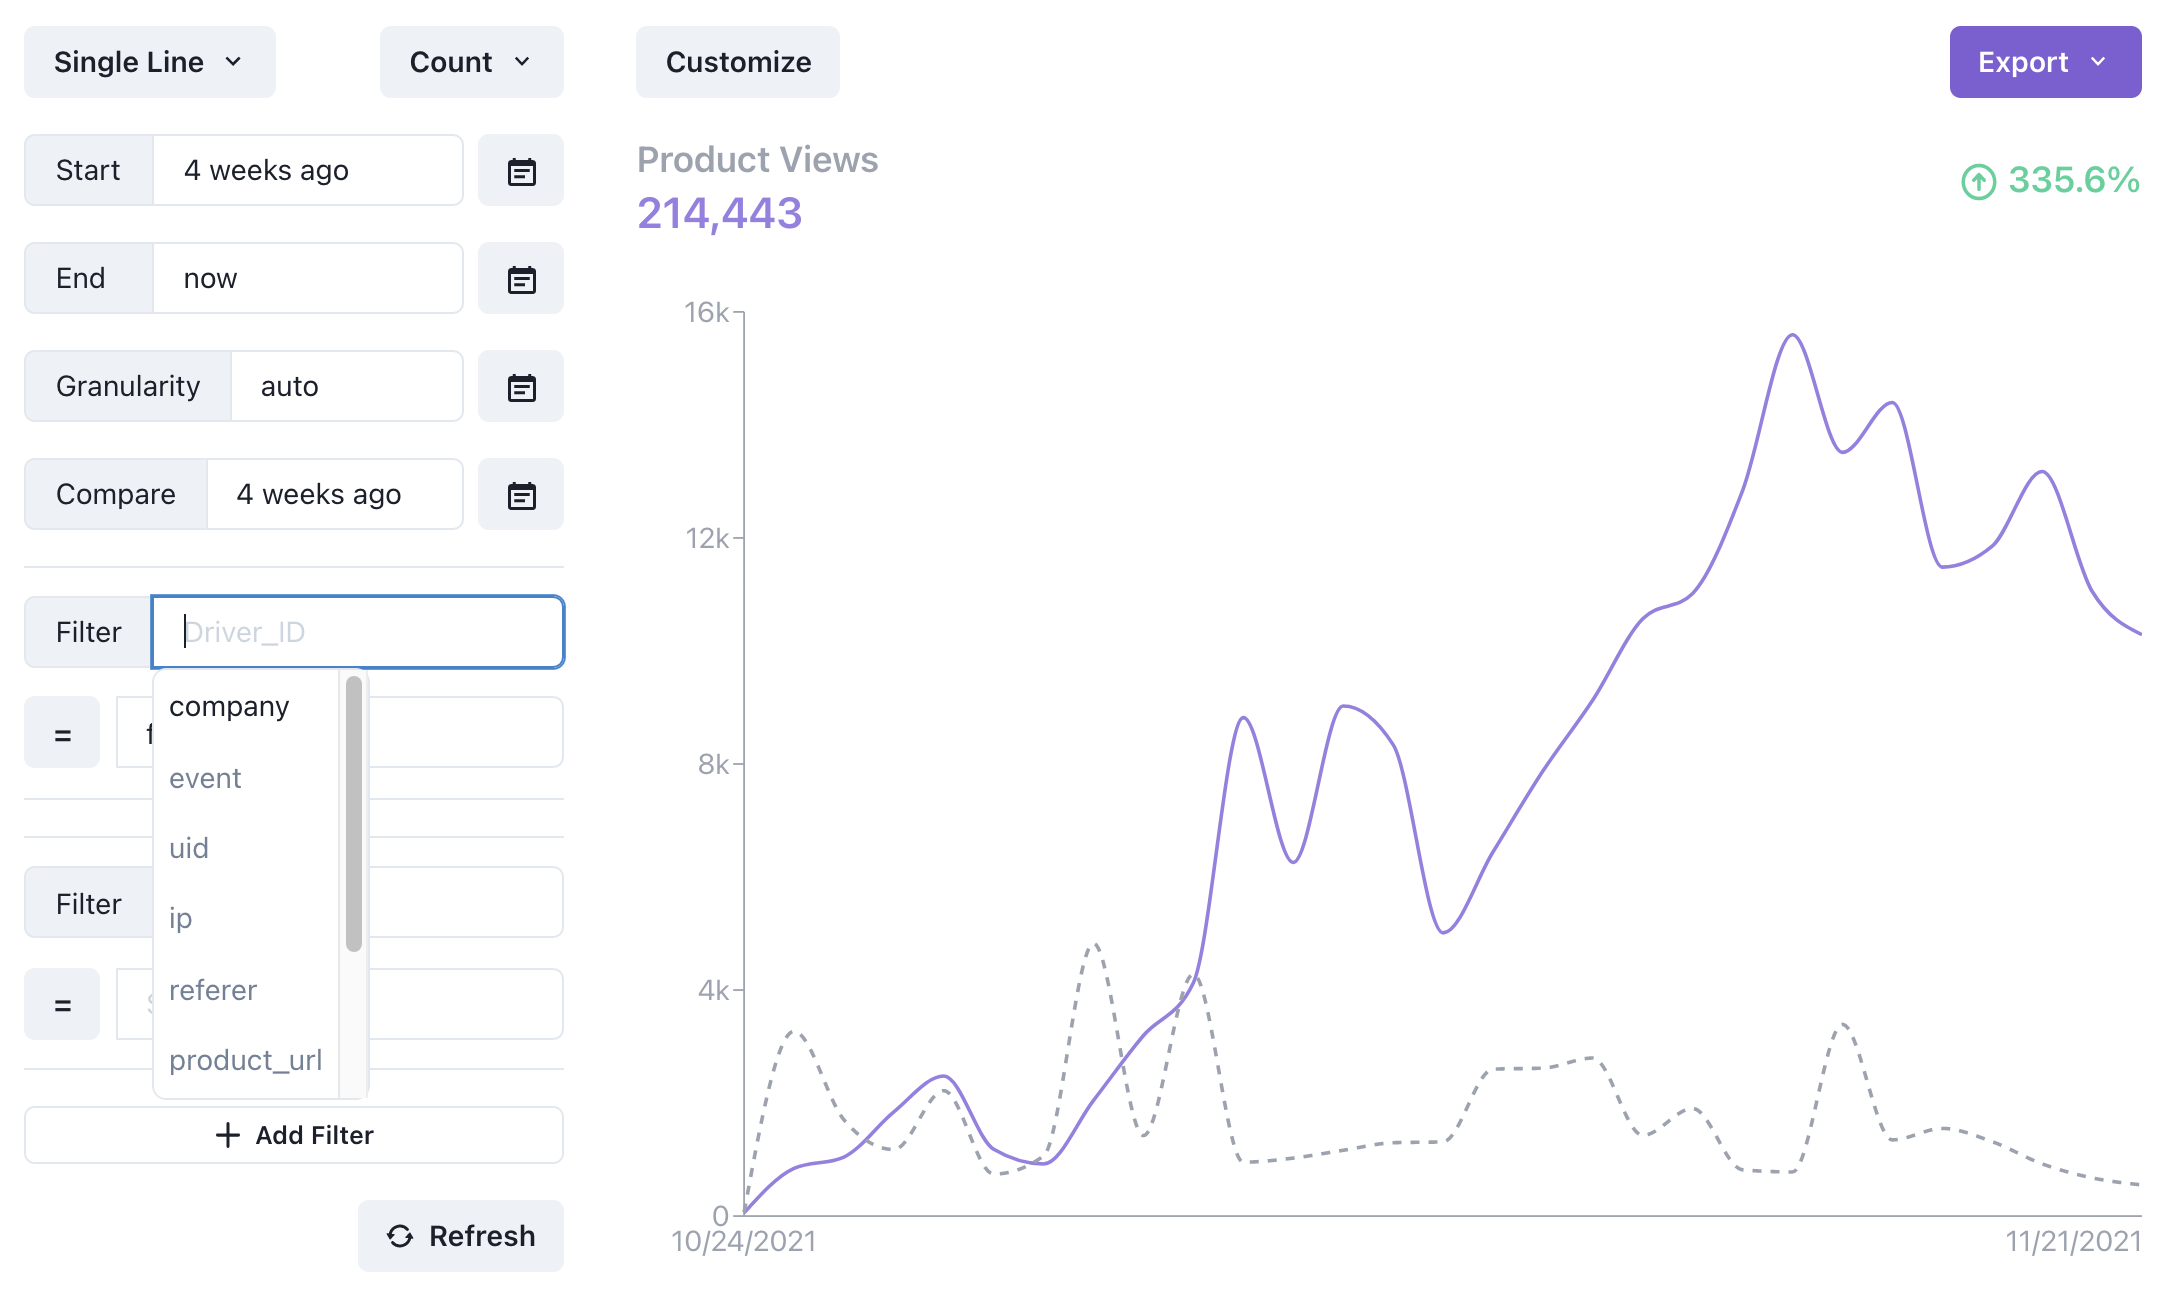
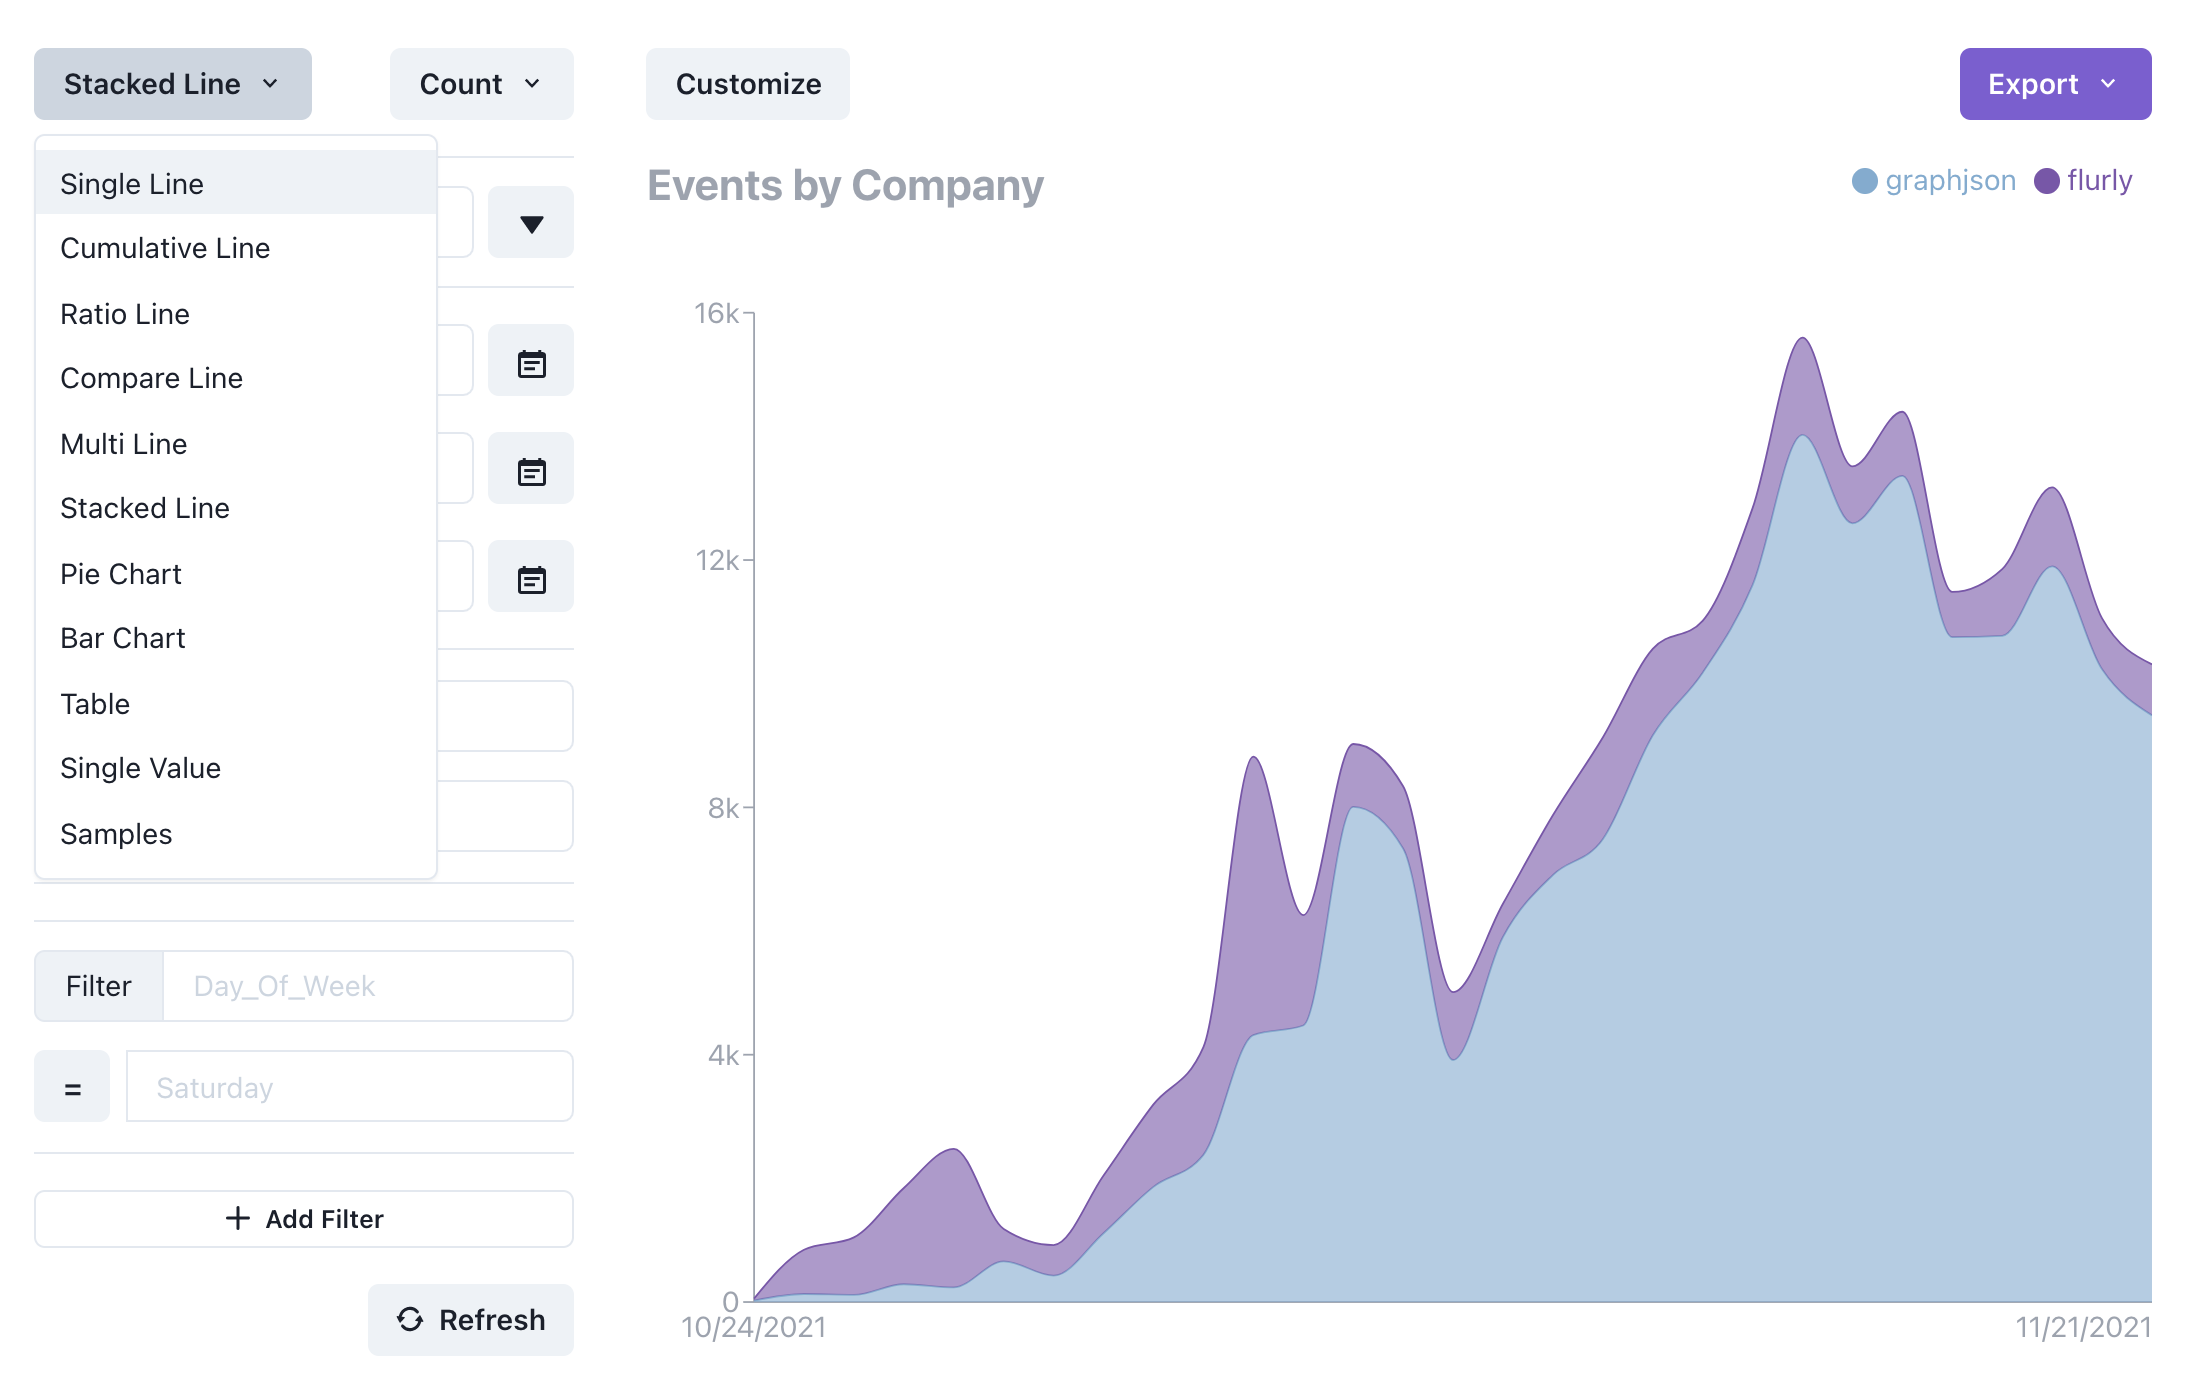
The result can be a time series, comparison, single value, table, funnel, retention curve, or another visualization suited to the question.
SQL is the escape hatch, not a separate product#
Every visual tool eventually meets a question its controls cannot express. That is usually where a lightweight analytics product tells you to export the data into a serious one.
GraphJSON exposes ClickHouse SQL notebooks over the same events instead. You can write joins, conditional aggregates, window functions, or JSON extraction directly, and then visualize the query result without moving it anywhere.
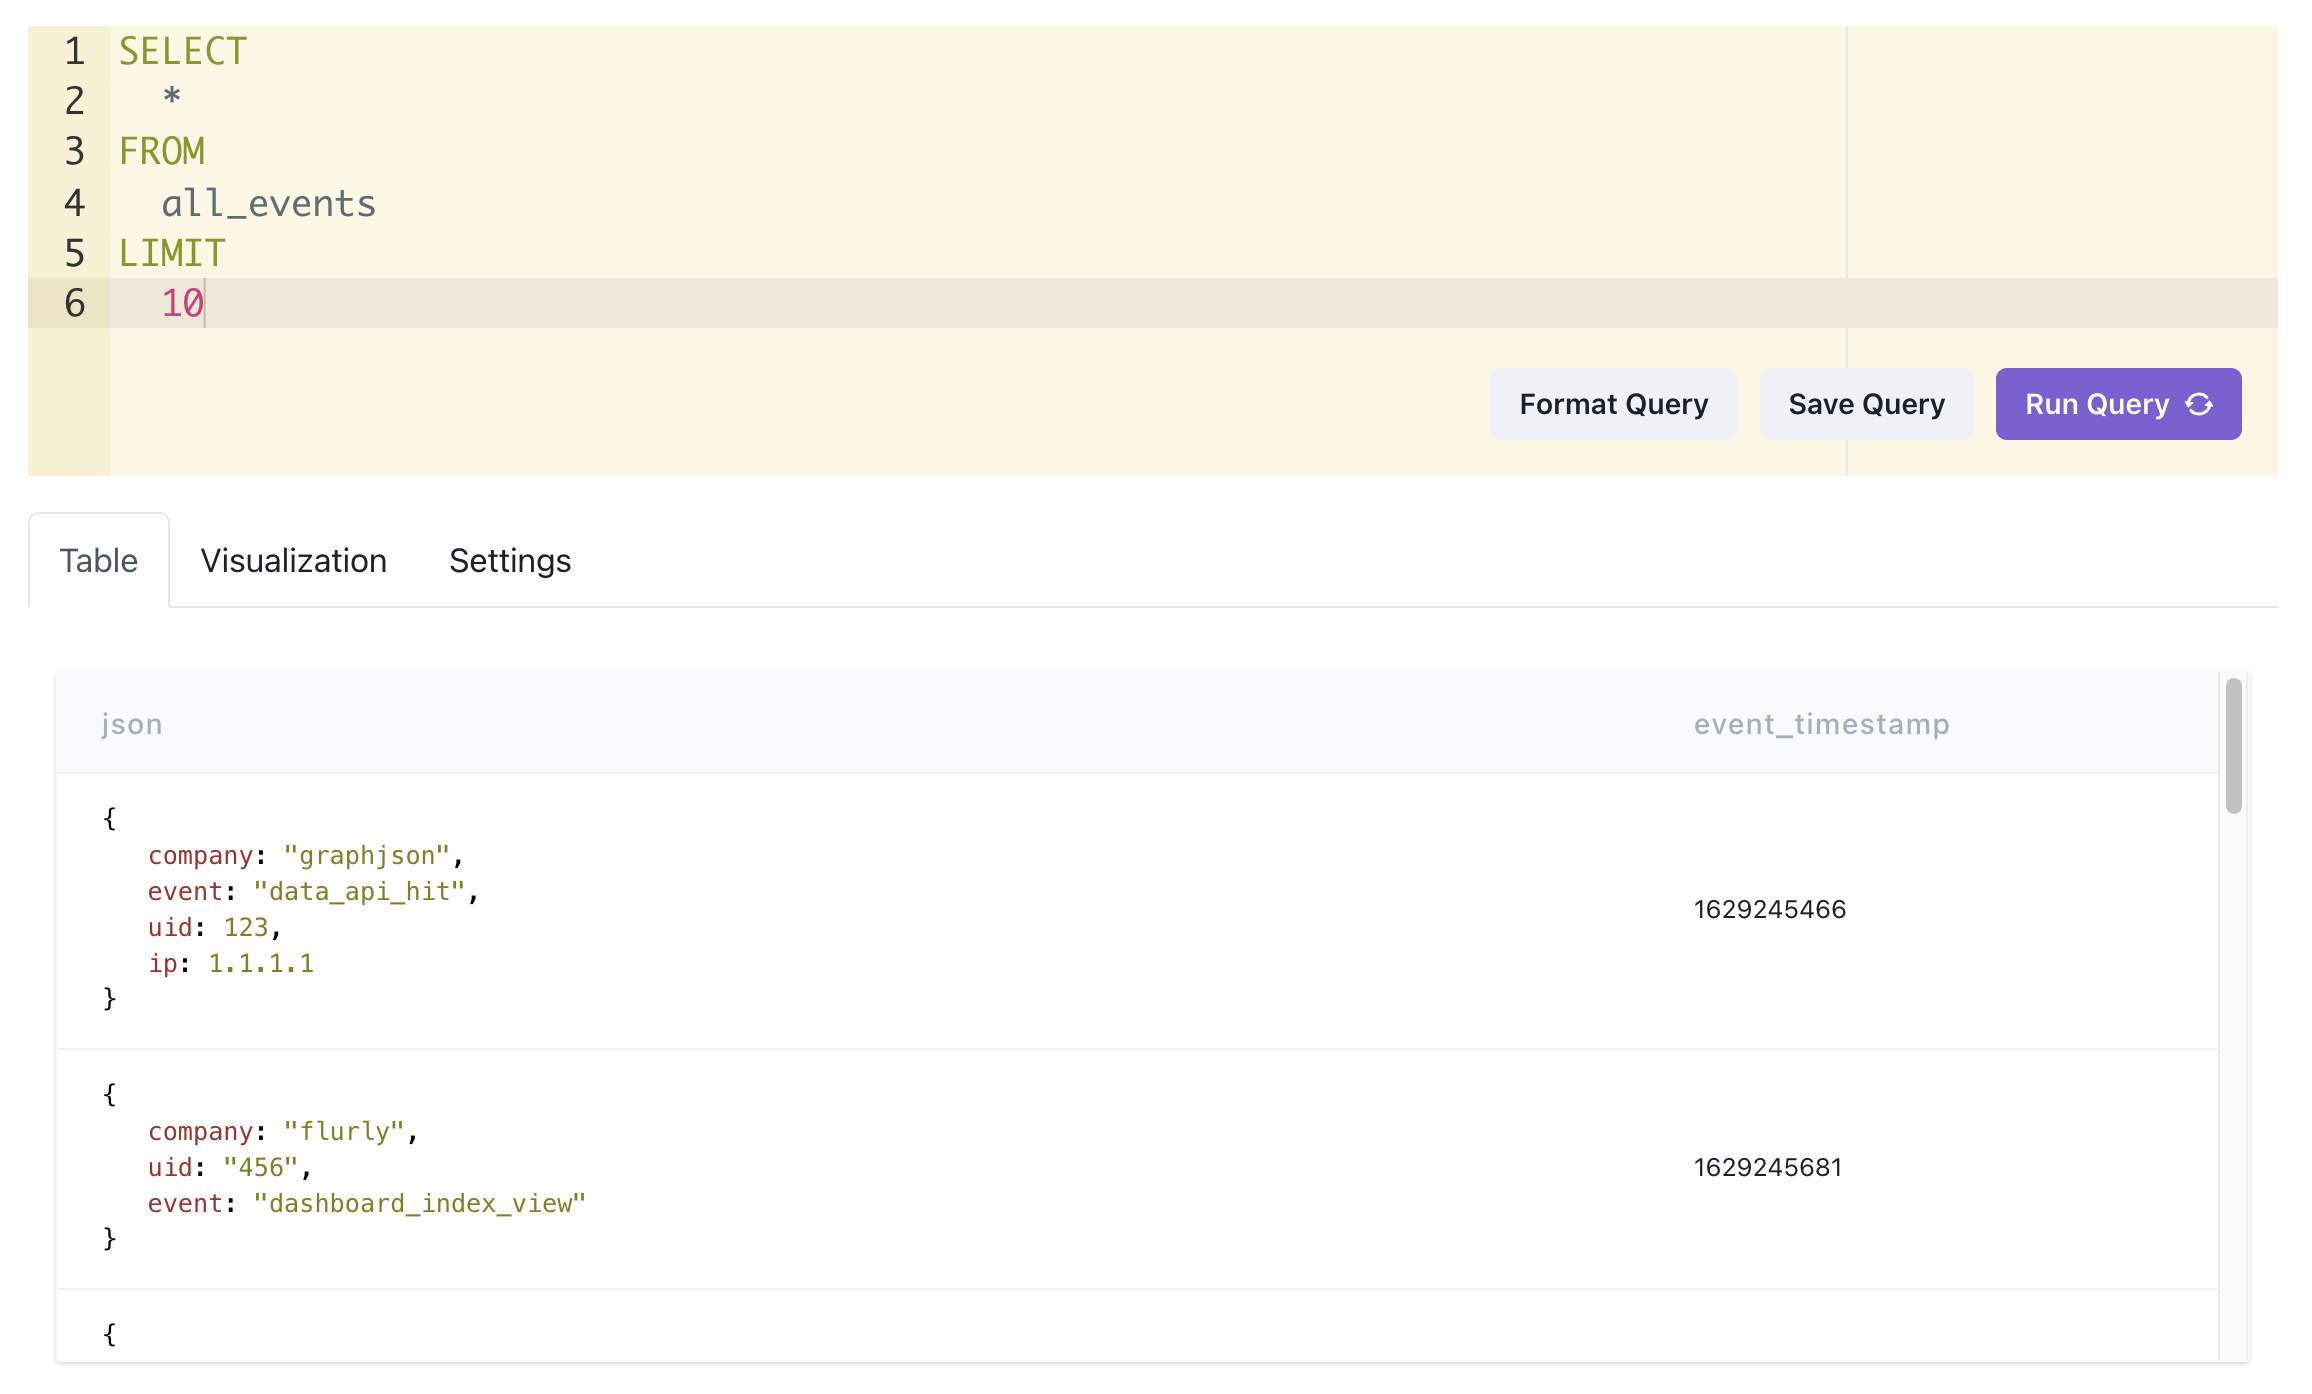
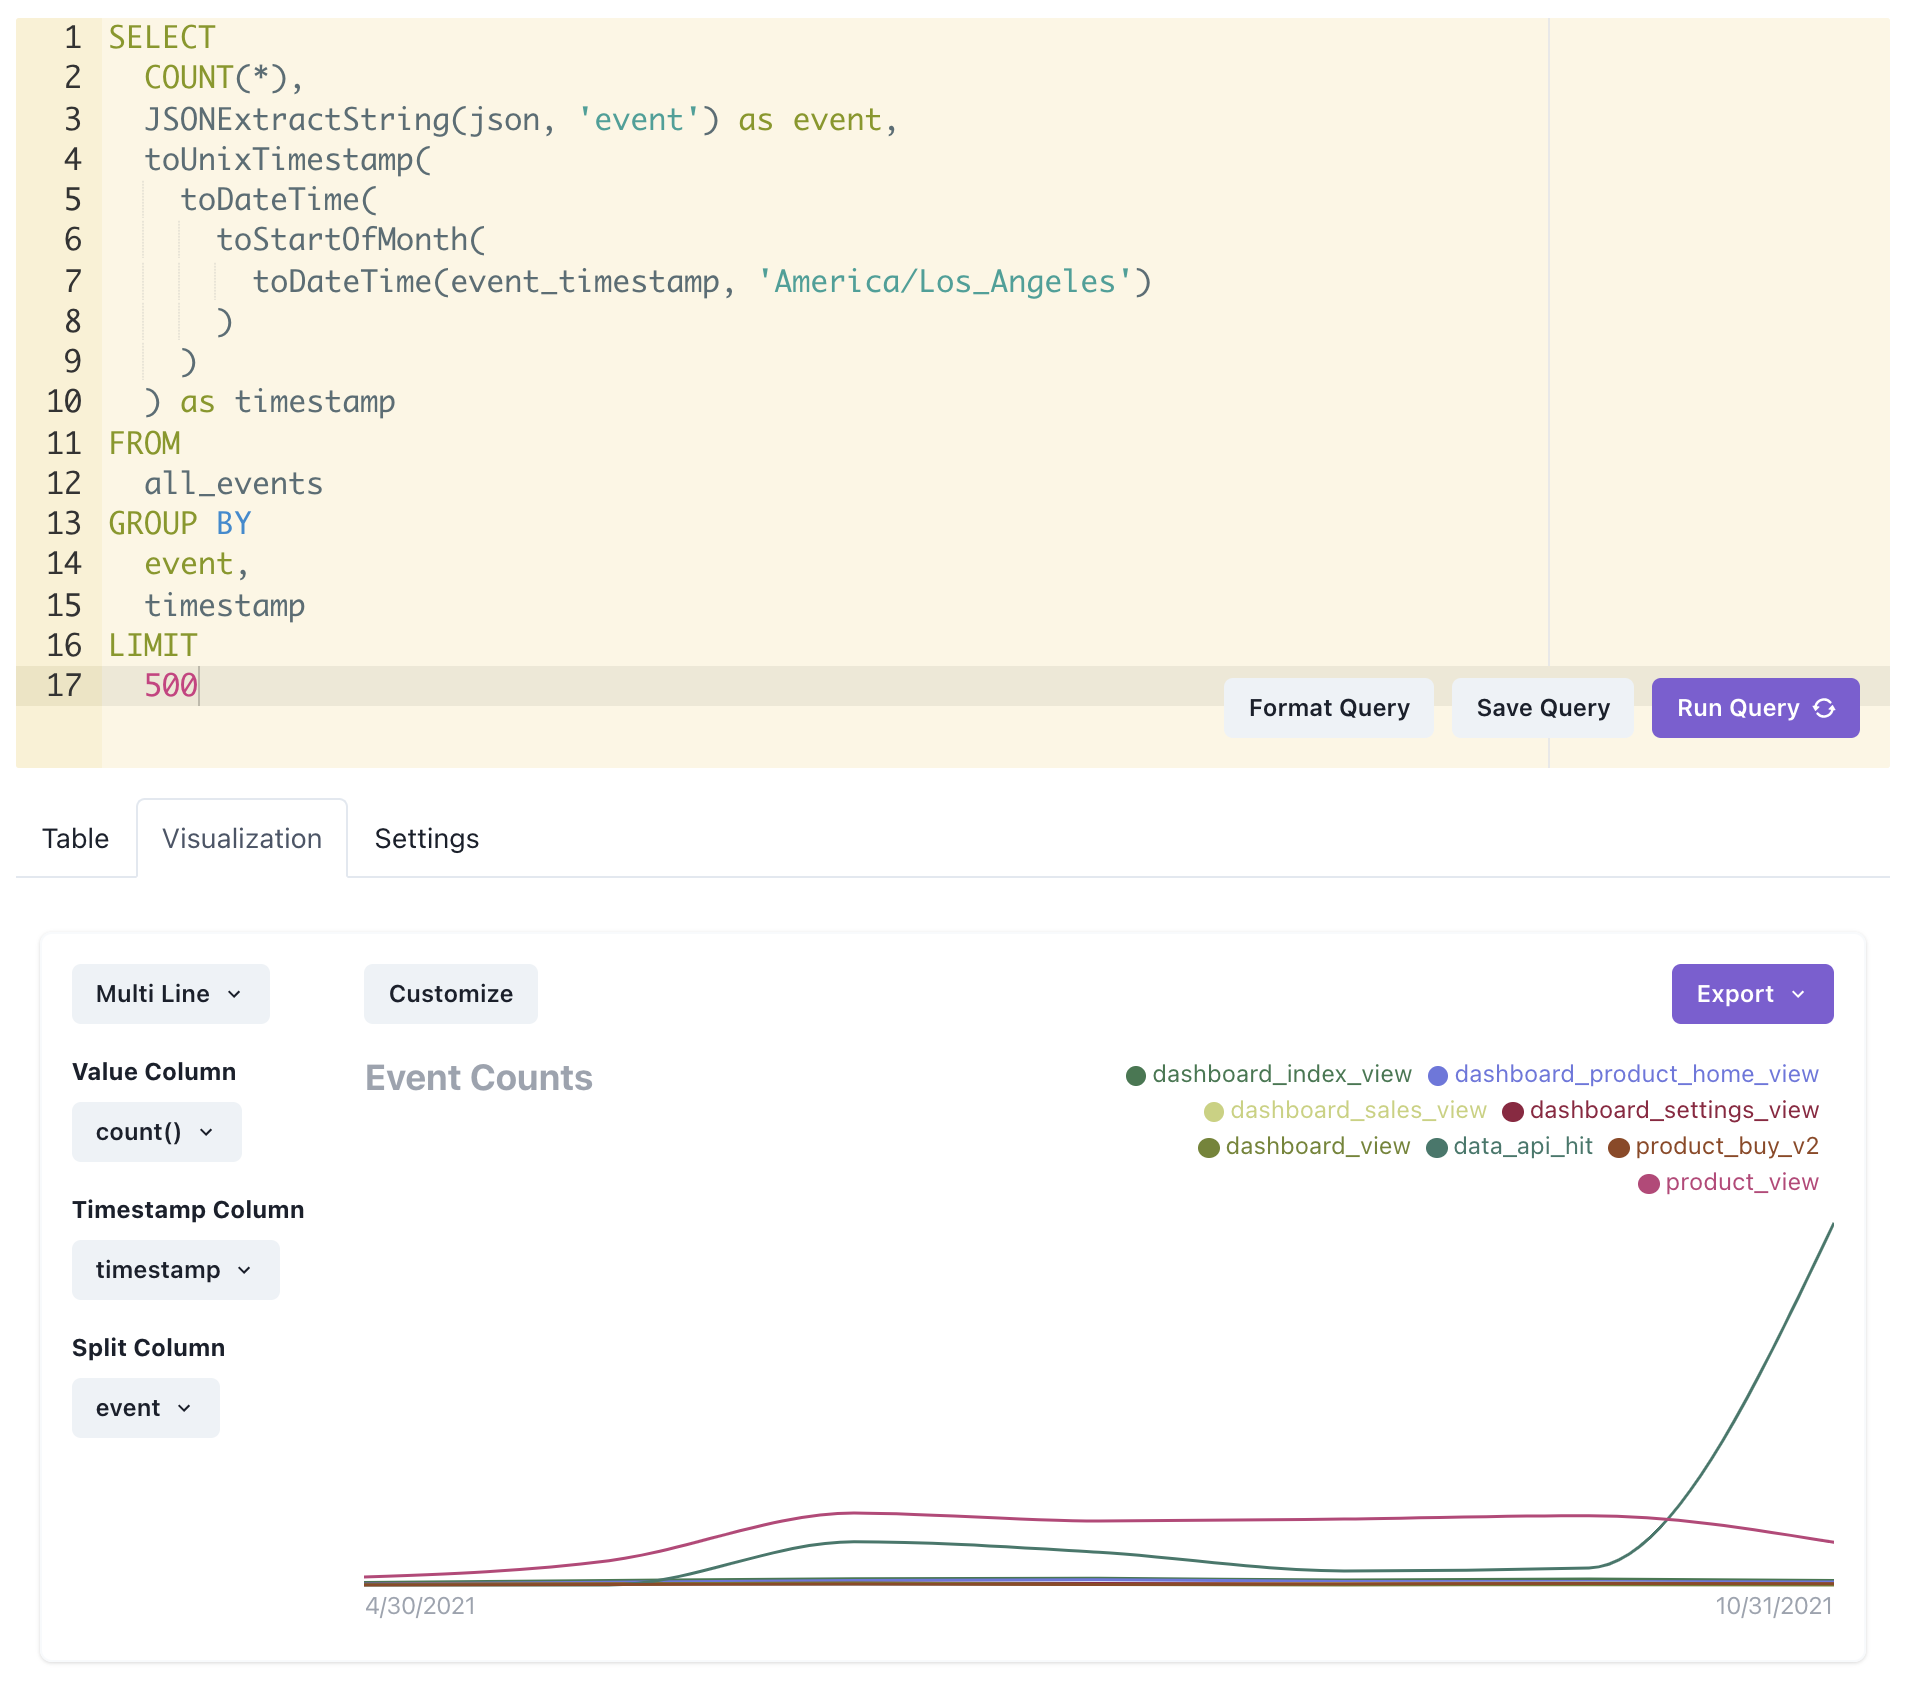
The point-and-click surface and SQL are two levels of the same workflow: start quickly, then keep going when the analysis gets specific.
An answer should be reusable#
Exploration is only the beginning. Once a query matters, GraphJSON can turn it into something operational:
- a dashboard for your team
- an alert when the value changes
- a CSV for further analysis
- a secure graph or dashboard embedded in your product
- a personalized view filtered for the current customer
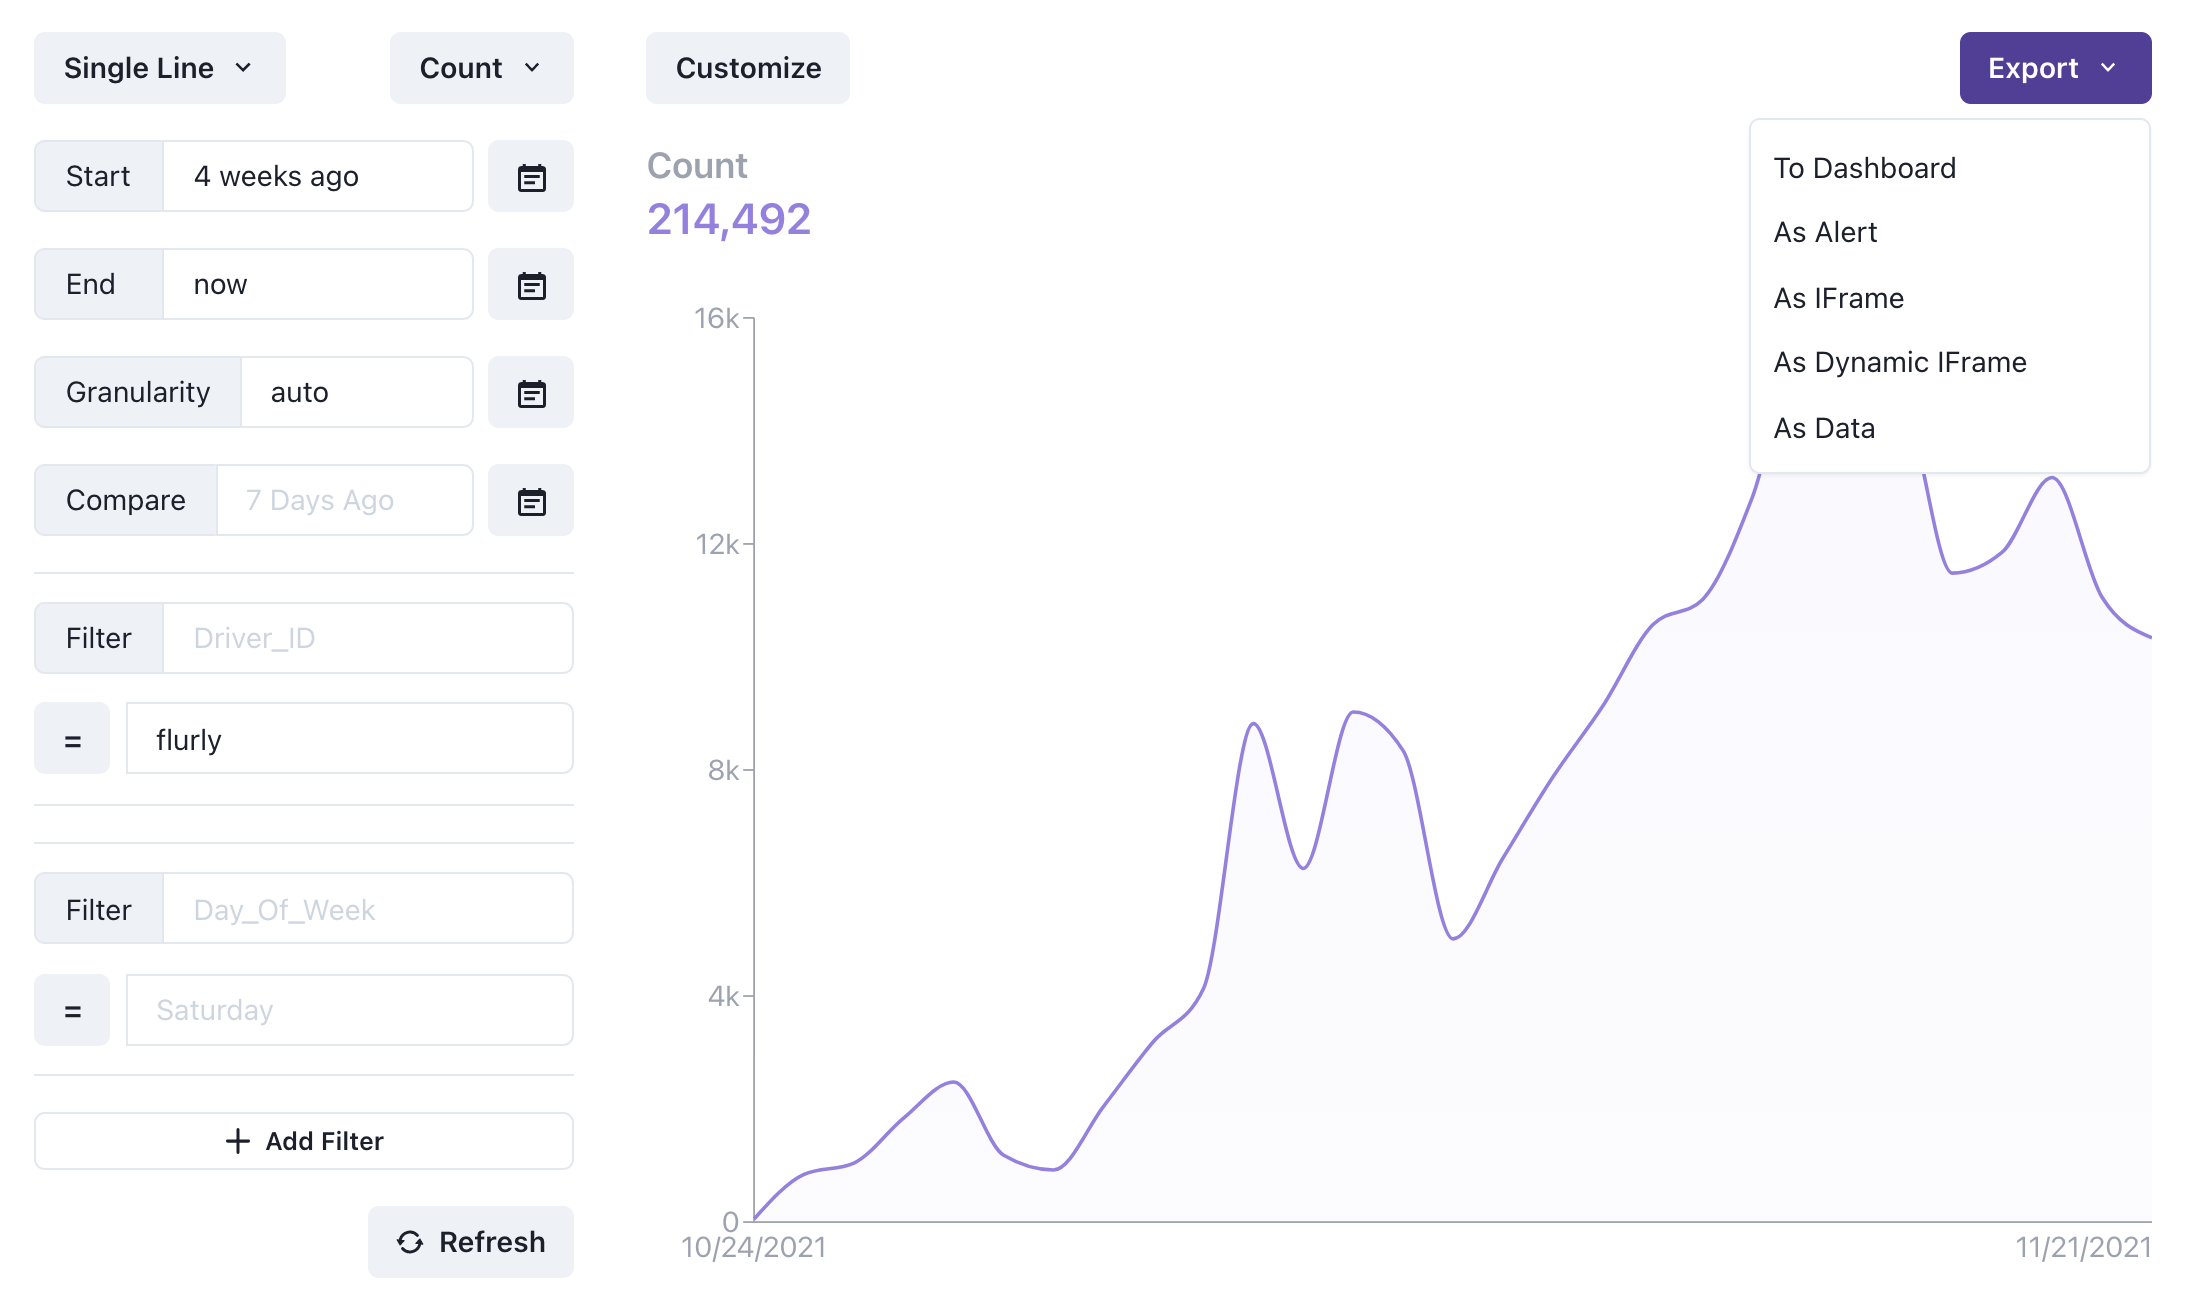
That last use case was especially important from the beginning. Building customer-facing analytics usually means maintaining queries, caching, chart components, and tenant isolation. GraphJSON lets you build the analysis once and apply server-generated filters for each viewer. The personalized dashboard guide shows the full pattern.
What has not changed#
GraphJSON has added collections, alerts, integrations, dashboards, embeds, and SQL notebooks since the first version. The standard for the product remains the same:
Shorten the path from “something happened” to “we understand why.”
If that sounds like the analytics workflow your team needs, follow the five-minute quickstart or create a free account.

Written by JR
Founder and builder of GraphJSON.

